Rocket Launch Visualizer
Built With
Description
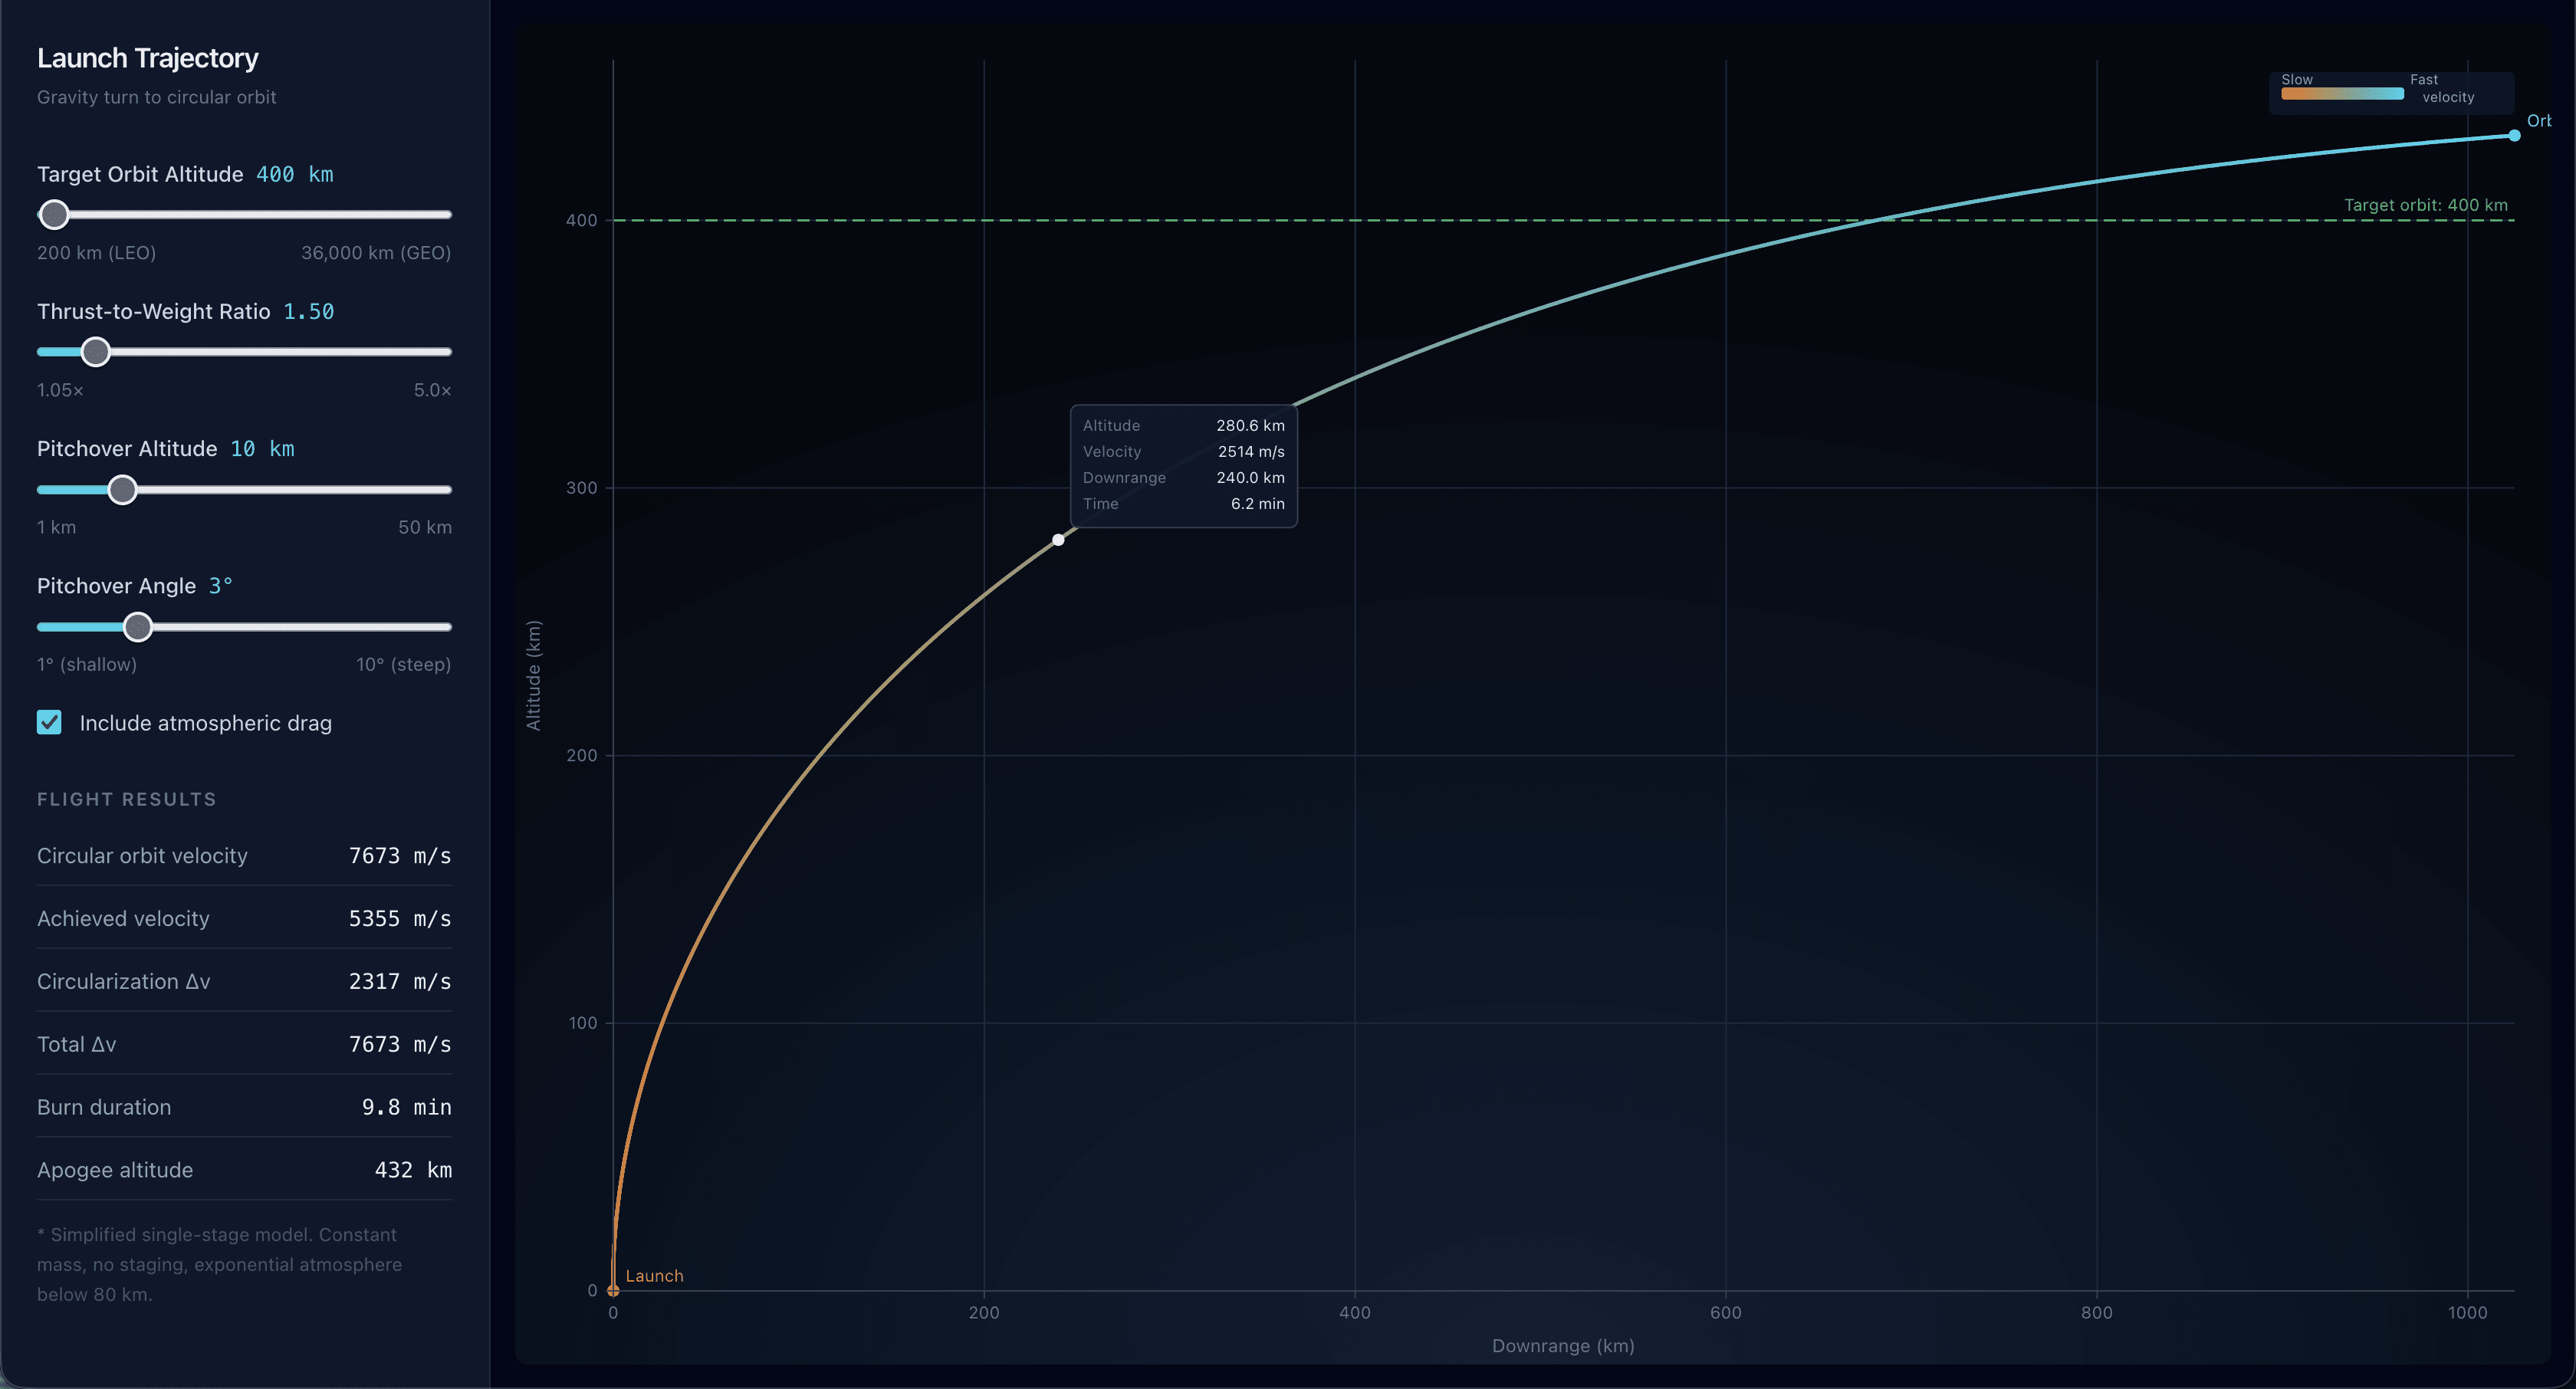
Getting a rocket to orbit isn't just about going up, it's about going fast in exactly the right direction at exactly the right time. This interactive visualizer lets you manipulate launch and orbital parameters and watch in real time how each decision shapes a flight path's viability and efficiency. A must-try for Kerbal Space Program veterans and rocket enthusiasts alike.
Motivation
I've sunk more hours into Kerbal Space Program than I'll admit. There's something uniquely satisfying about the moment a rocket officially reaches a stable orbit, but KSP abstracts a lot of the real physics away. I kept wondering what the numbers actually look like: how much does launch angle matter? How do thrust-to-weight ratios interact with atmospheric drag as altitude increases? I built this visualizer so I could explore those questions directly. Adjust a parameter, watch the trajectory shift, and build genuine intuition for why achieving orbit is about speed and direction, not just going up.
Technical Challenge
Generating a flight path means integrating forces like thrust, gravity, and drag across thousands of time steps for every combination of input parameters. The challenge was making each parameter adjustment feel instant even though recomputing the full trajectory is expensive. I solved this with memoization: trajectory results are keyed by their input parameters and cached, so only the affected calculation reruns when a single variable changes. D3 handles rendering, but structuring the data flow so transitions fire only on real changes, not on every reactive update, was the other half of keeping the visualizer smooth under continuous user input.